In recent years, there have been some devastating wildfires that have burnt across both protected native regions and productive farmland. This article aims to help you detect and visualize burned-out areas. As fire is life-threatening and has consequences relating to property loss and insurance, it's important to note that even the best spectral indices can get it wrong. On-the-ground validation is necessary to confirm any assessment. With that said, let's see what we can discover.
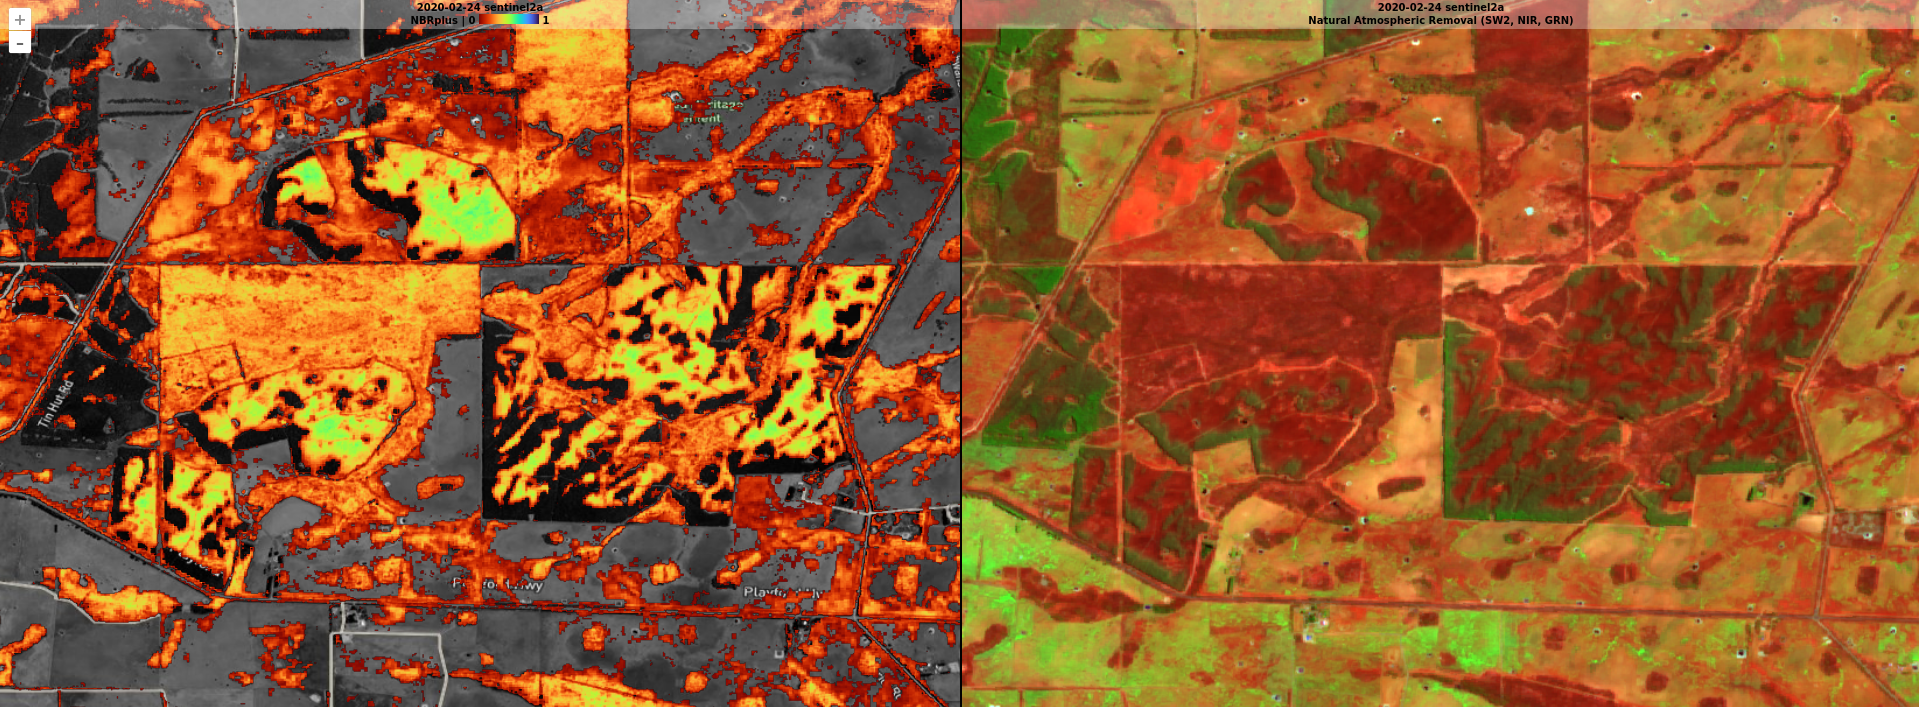
In 2022, Alcaras et al. published a paper proposing a new spectral index to detect burned areas that dealt better with misclassifications of clouds and water bodies as burned areas. This is called Normalized Burn Ratio Plus (NBR+). NBR+ is available to use in the Satellite Imagery app. My understanding is that a value over 0 is considered likely to be a burned area. This will work well with the Transparency Thresholding tool since we can display the burned areas over the high-resolution base map.
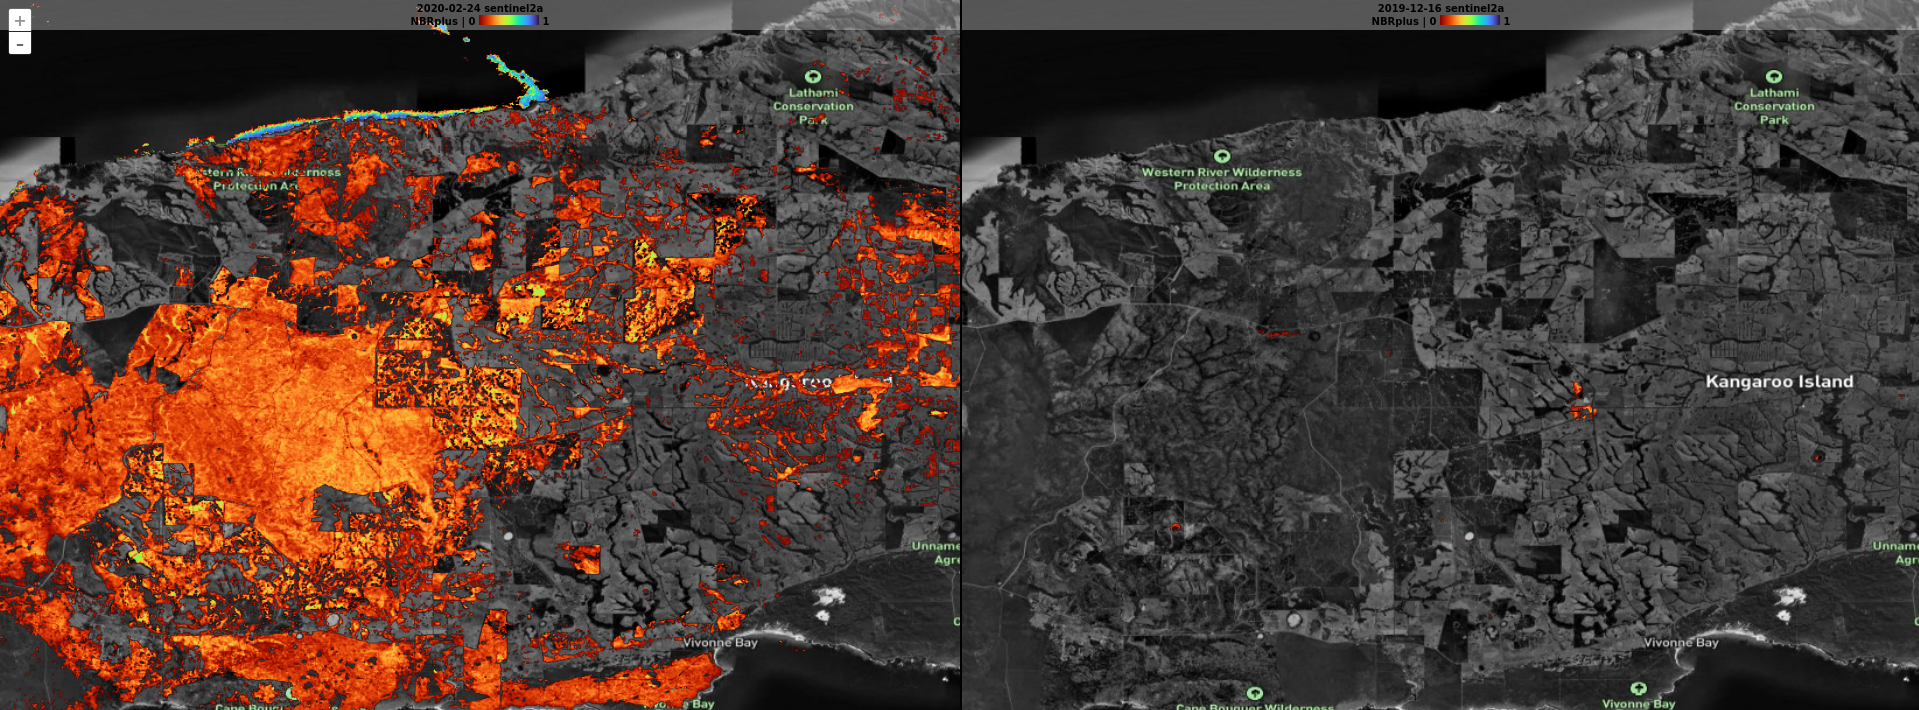
I am going to concentrate on the well-known fire event that happened in December 2019 & January 2020 at Kangaroo Island, Australia. This was devastating for the community as tragically two people lost their lives, over 32,000 livestock were lost, and almost half the island was burned.
I find it useful when investigating an event to compare an image captured just before the event to one soon after. This is what we will do with Kangaroo Island.
To Load Up the Burned Area Visualisation:
- Navigate to Kangaroo Island and search and display the 2020-02-24 Sentinel 2A image.
- Toggle on Indices in the Processing Tool.
- Next, uncheck the Shortlist checkbox.
- Open the list of Spectral Indices and find NBR+.
- The default range slider settings with limits set to 0 to 1 should work fine.
- Click the MultiMap button to open a second map and press the '2' button so you are working on that map area.
- Repeat steps 1 to 4 but choose an earlier date such as 2019-12-16.