Satellite sensors can be used to detect crops that are just established, but it can be difficult due to the distance between the sensor and the ground, atmospheric interference, and the fact that there is usually more soil or previous crop residue exposed to the sensor than crop biomass. Additionally, early stage crops often have a more erect leaf, which is more visible looking across a paddock than from directly above.
Despite these challenges, there are still benefits to using satellite imagery to understand early crop establishment. For example, satellite imagery can be used to:
- Monitor crop emergence patterns
- Identify management-driven errors - e.g., planter not switched on
- Allow planter setup comparisons - two planters in the same paddock will often have different results
- Identify areas that warrant on the ground inspection
This guide will provide an overview of the strategies that can be used to understand early crop establishment using satellite imagery.
Things to be Mindful Of:
Previous crop residue and soil color can impact vegetation index results. Some indexes more than others. For example, if part of the paddock was burned, the stark contrast of highly reflective cereal stubble to black ash could still impact many of the vegetation indexes available.
When a color scale with lots of different color steps is condensed down to a very small range it is useful for detecting variability but sometimes the differences seen could even be sensor or processing related artifacts. Overall when working in situations with the sensitivity dialed right up, question everything.
This guide assumes you are familiar with the basic functions in Agriobs.
Initial Suggested Setup:
- Find the most recent cloud-free imagery available - Sentinel or Landsat 8/9 will be OK. In regards to cloud, even a slight haze will have a big impact. Find your field of interest.
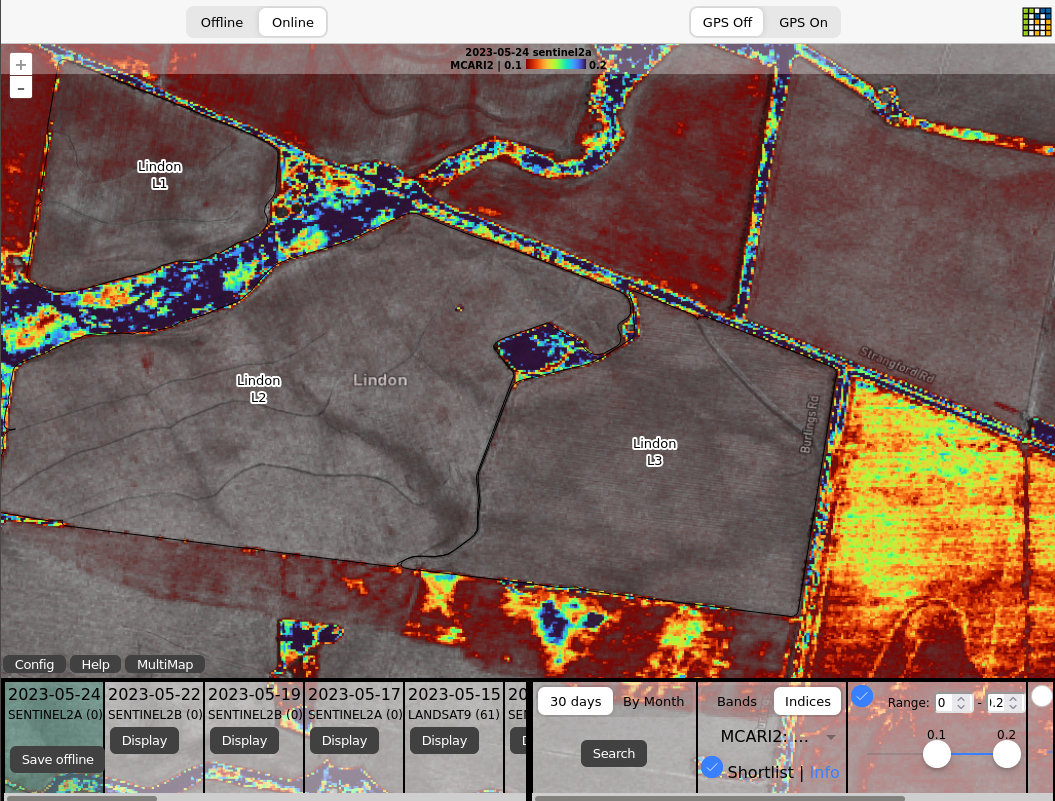
- The default MCARI2 index is a good place to start.
- Set the Range Slider min and max limit boxes to 0 and 0.2. This makes the slider easier to operate. Set the slider minimum to 0.1 and maximum to 0.2. Anything well established is going to show here even in the low end (red) of the color scale.
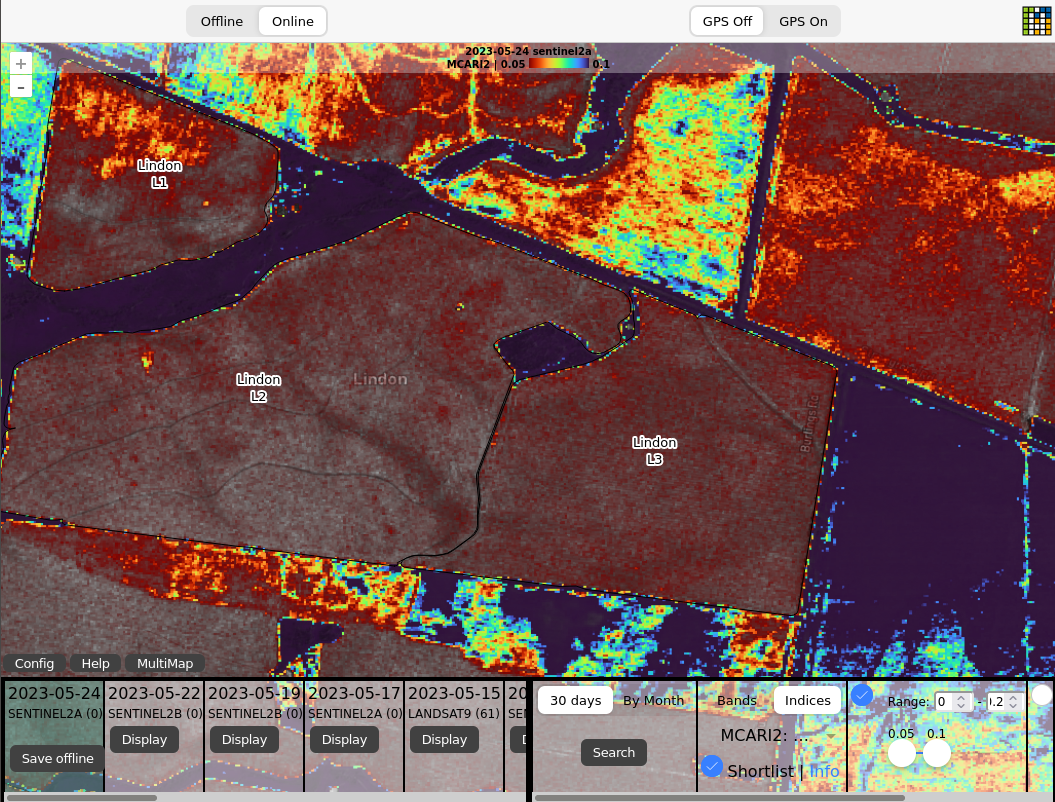
- Now change the range slider from 0.05 to 0.1. Now the more established crops will saturate to blue but the emerging crops will become more evident. You can continue to reduce the minimum but going too far will just result in a whole lot of red and you won't be utilizing the transparency thresholding. No harm in experimenting.
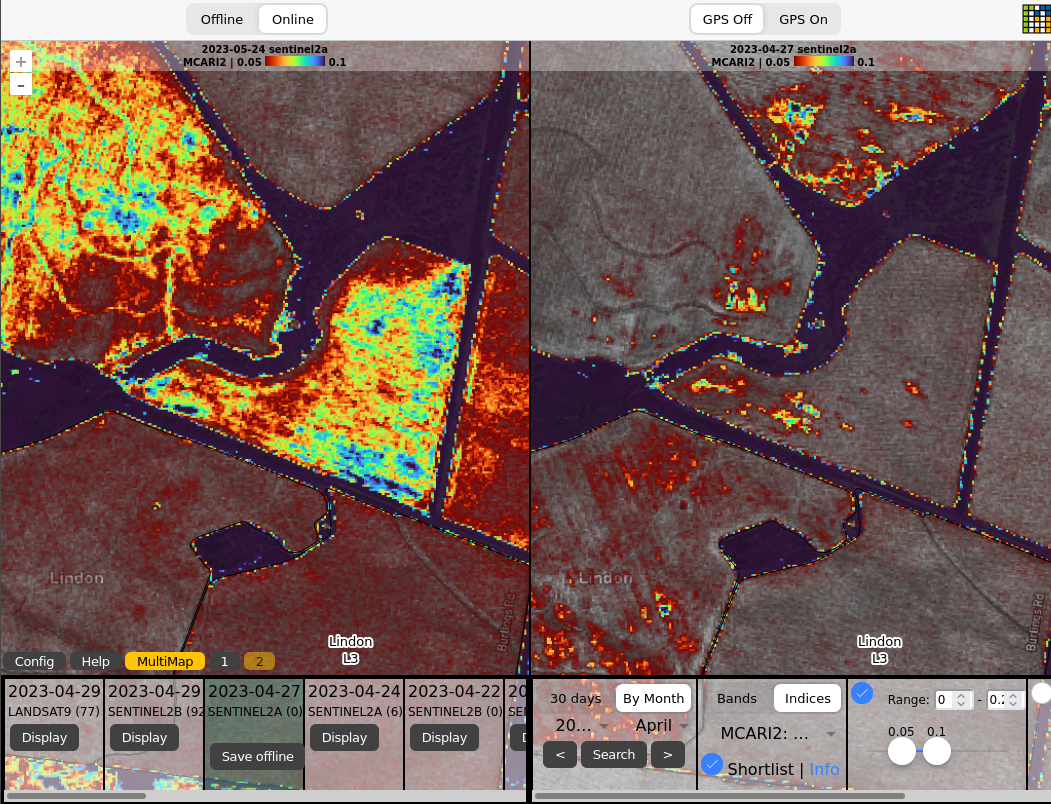
- One of the best ways to know if the variability you see is crop-driven or existing ground cover is to load up a multimap with exactly the same settings on each side except have one map contain a date as close to just before the crop was planted and the other most recent. You will be able to see if patterns already existed or are evident since the crop emerged.
- This particular example below is 24 May on the left (post planting) and 27 April on the right (pre-plant). While we don't see much impact from soil color, we can see the extent of the fallow weeds leading up to planting and examine the potential impact on establishment in those areas.