There are some great processing options to help visualise water across the landscape. This can be useful for monitoring dams, flood water, channels, and environmental flows. As water is fluid and often moving or evaporating, the imagery data is just a moment in time. Sometimes we can get lucky and get shots timed perfectly. Other times, not so lucky. But it is best to make the most of what we get.
Band Combination
Firstly, a Band Combination that uses Short Wave (SW1 or SW2) in the blue band will display water as a vivid blue. If we then put near infrared (NIR) on the green band, we get vivid green on vegetation. It just so happens that the default Band Combination set in Agriobs fulfills these requirements. Natural Atmospheric Removal is SW2, NIR, Green in Blue, Green, Red color space. If that's a bit confusing, let's see what it looks like in pictures.
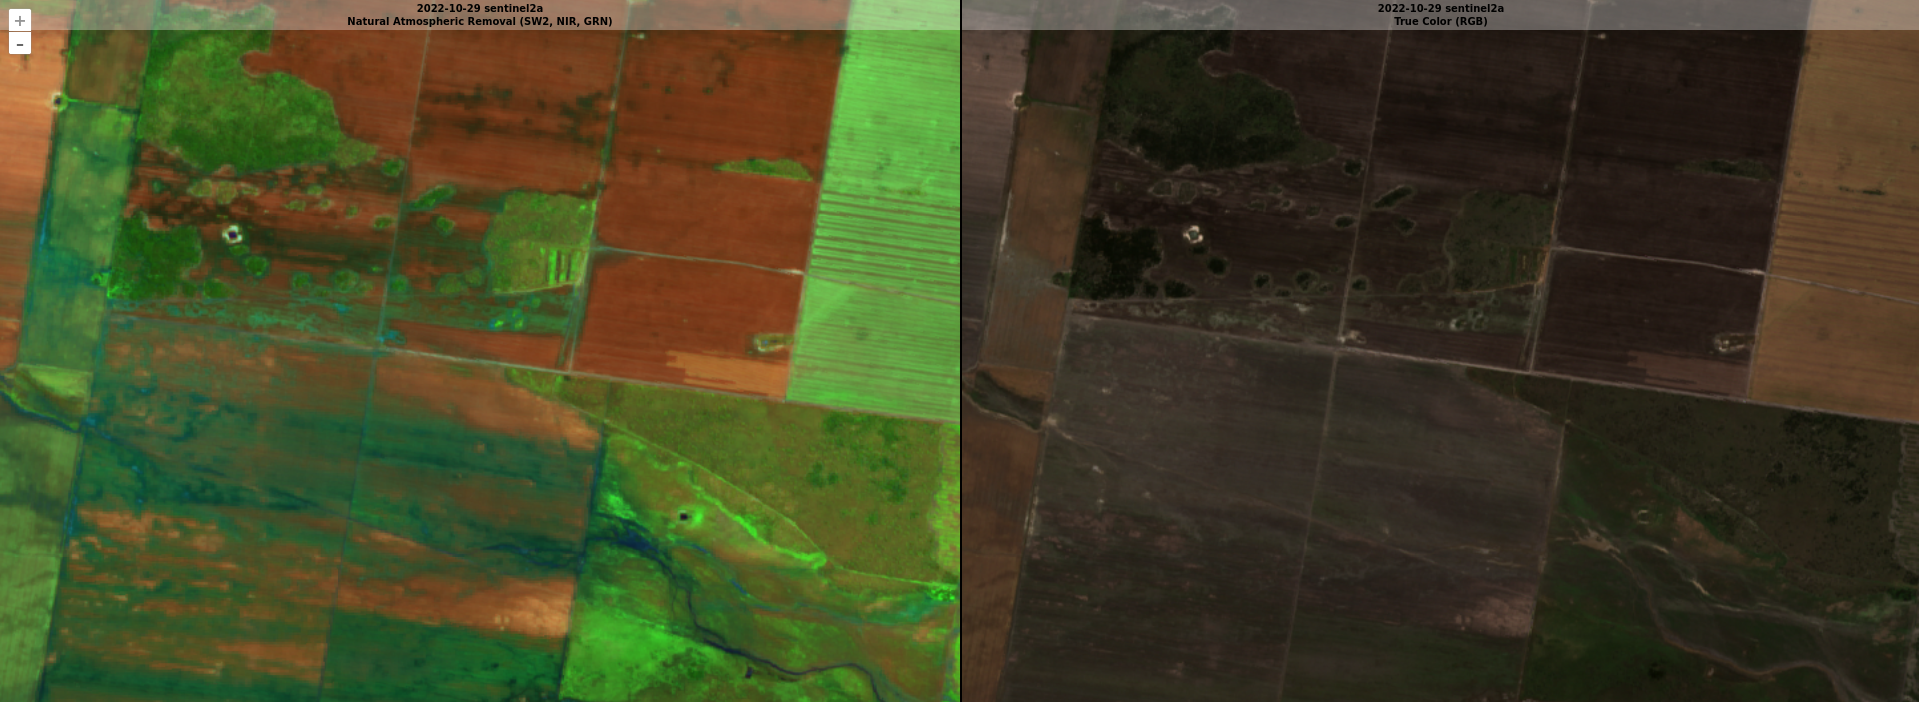
Looking at the above comparison, there is Natural Atmospheric Removal on the left and True Color on the right. The True Color combination puts blue, green, and red in their natural places to create a realistic view. As you can see, the left side creates a more acute contrast between the water, vegetation, and stubble.
Note that this is a somewhat difficult water detection task as the water is spread out over very flat ground, making it quite shallow.
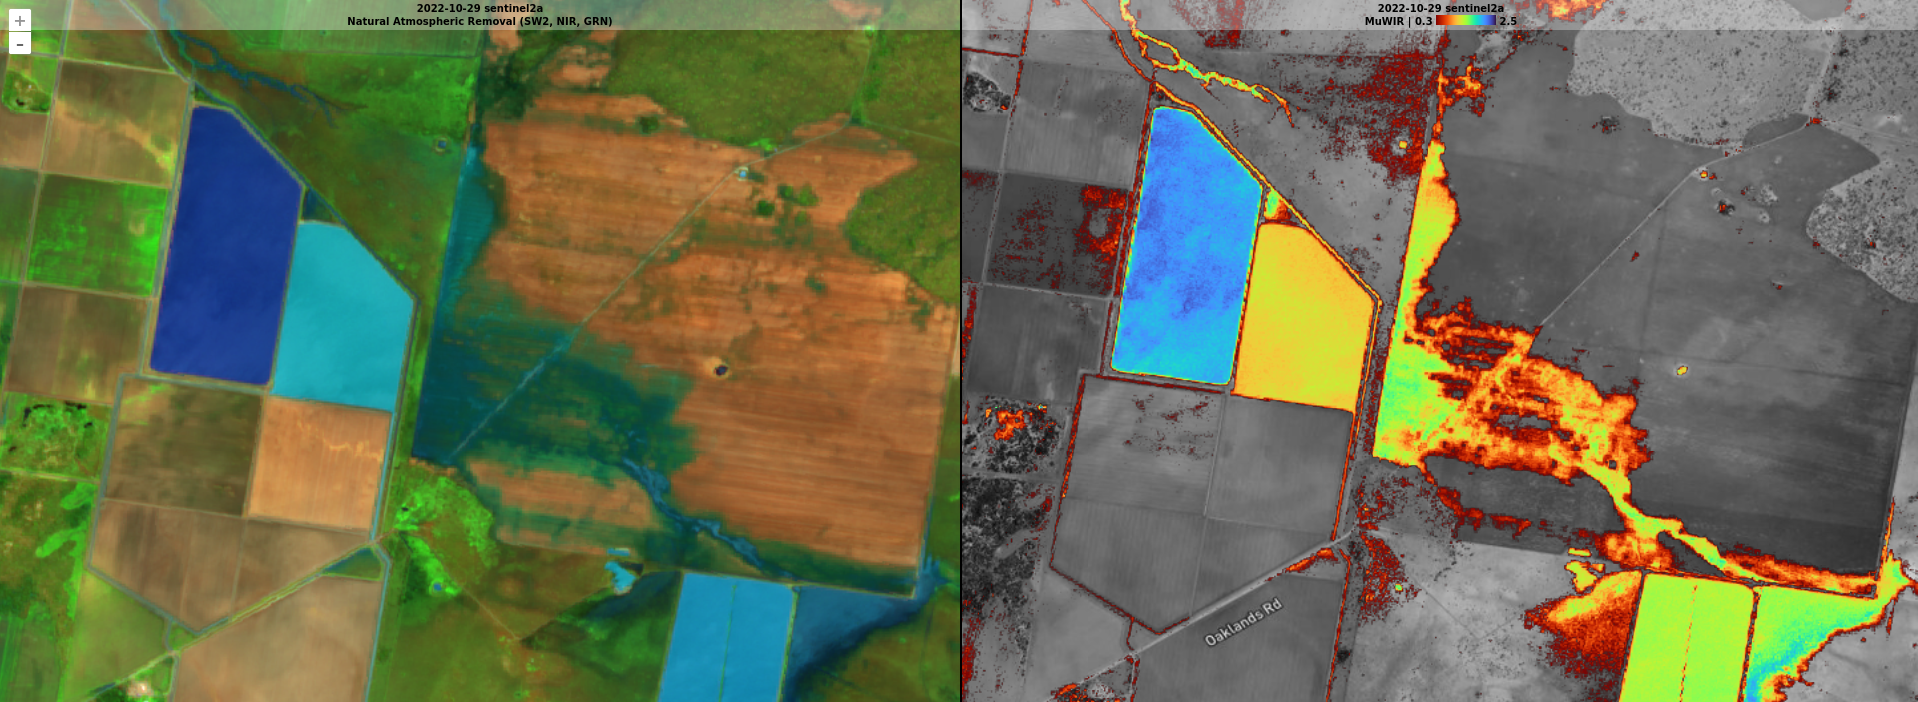
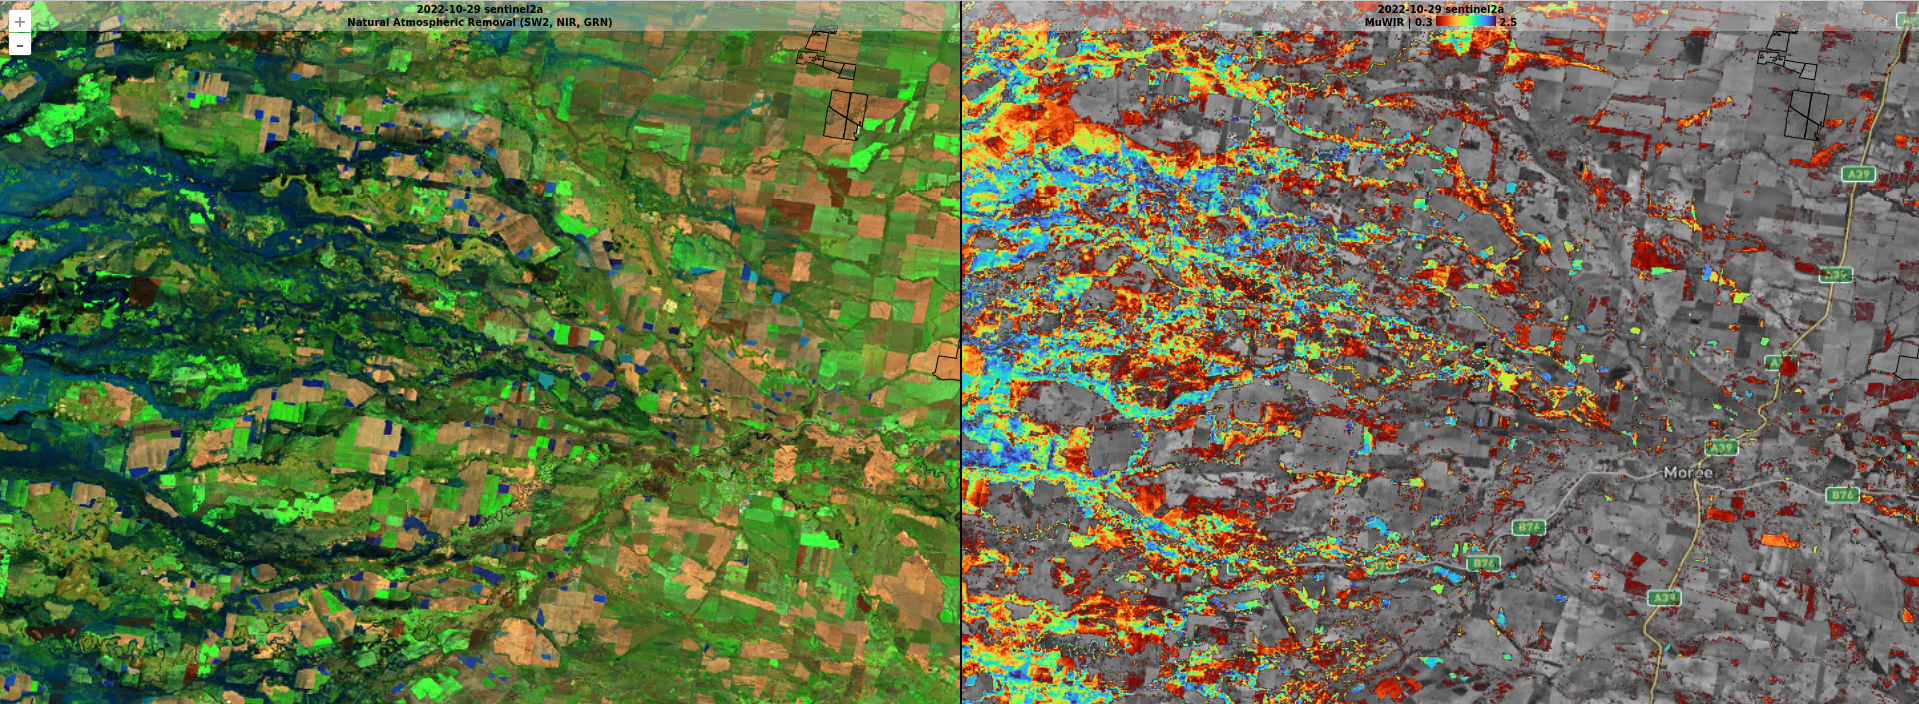
Water Index
The benefit of the water index is that we can use Transparency Thresholding to expose the high-resolution base map where there is no water. This creates great contrast and also reveals features not usually noticeable in the layered imagery. There are a lot of water indexes available in the Long List of Spectral Indices, but it's probably best to start with the Revised Multi-Spectral Water Index (MuWIR). After a bit of testing, I have found MuWIR seems to be more sensitive than the other indexes.
- Search and display suitable imagery.
- Toggle Indices in the Processing toolbox.
- MuWIR will soon be added to the short list, but for the moment you need to untick Shortlist.
- Open the Index select box and scroll until you reach MuWIR.
- Change the limit boxes to 0 and 2.5 for minimum and maximum, respectively.
- Slide the minimum up to about 0.3 to start. Going below 0.3, high biomass crops start to show as water. But in a paddock you know is fallow, reducing this to zero should be okay.